Hamed Abbaszadegan, MD, MBA
May 30, 2026
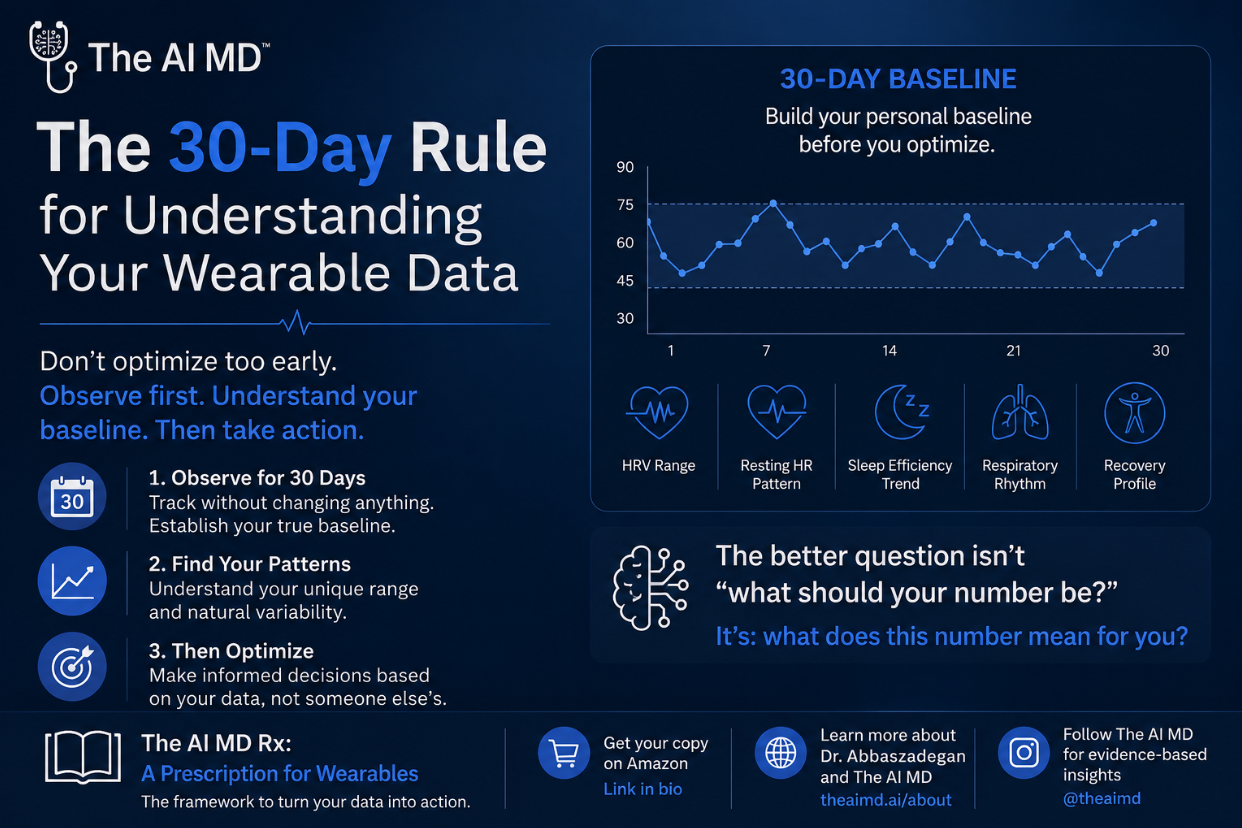
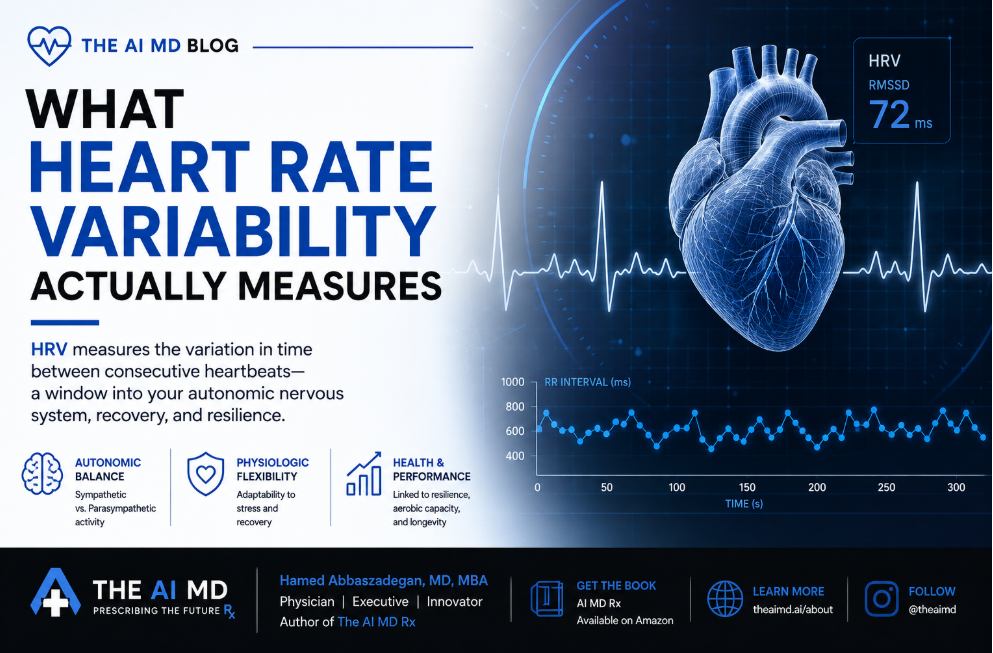
When someone shows me their wearable data and says "my HRV is low," I don't look at the number first.
I look at the trend.
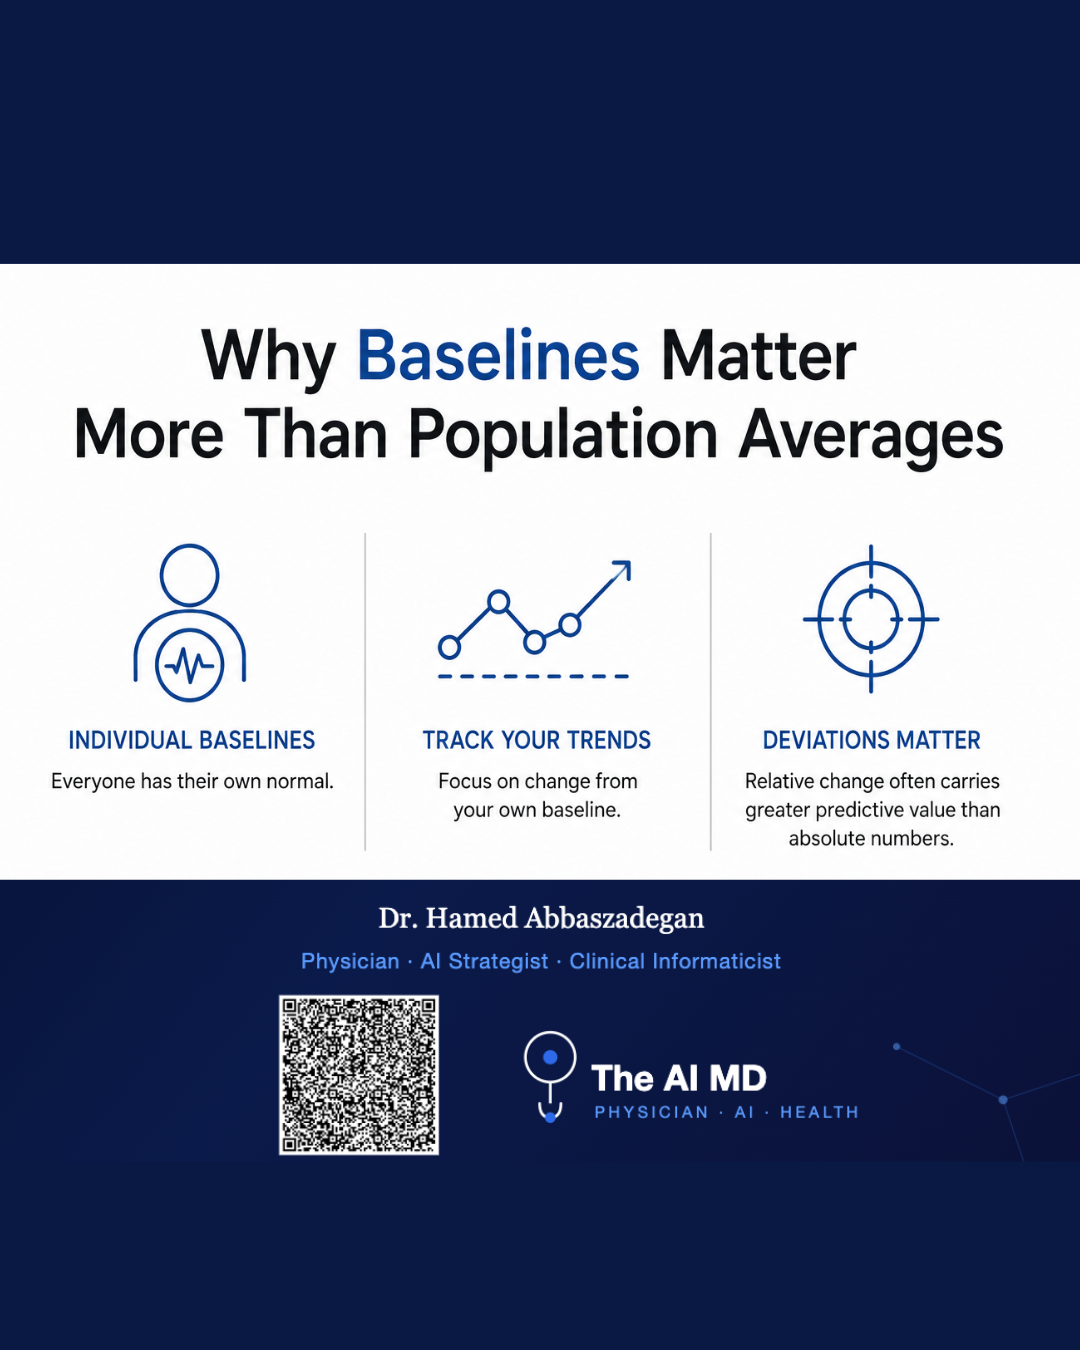
The raw number means nothing in isolation. Your baseline HRV could be 30 or 130, and both could be perfectly normal for you. What matters is whether you're seeing a downward trend from your personal baseline over time.
That pattern tells me something specific is happening physiologically. And most people tracking HRV don't realize what they're actually measuring.
HRV measures the variation in time between your heartbeats. When you see that variation decreasing, it signals sympathetic nervous system overactivation.
In healthy conditions at rest, your parasympathetic nervous system dominates in a roughly 4:1 ratio over sympathetic activity. This creates natural variability between heartbeats. Your heart speeds up slightly when you inhale, slows down when you exhale. That's good. That's adaptability.
When sympathetic activity increases and parasympathetic influence decreases, your heart rate becomes more rigid. Less variable. The numbers on your wearable drop.
Most people hear "sympathetic overactivation" and think it just means psychological stress.
It doesn't.
The body signals physiological stress through declining HRV. This could be an impending infection, inflammatory status, metabolic dysfunction, or several other factors.
Let me break down what the research actually shows.
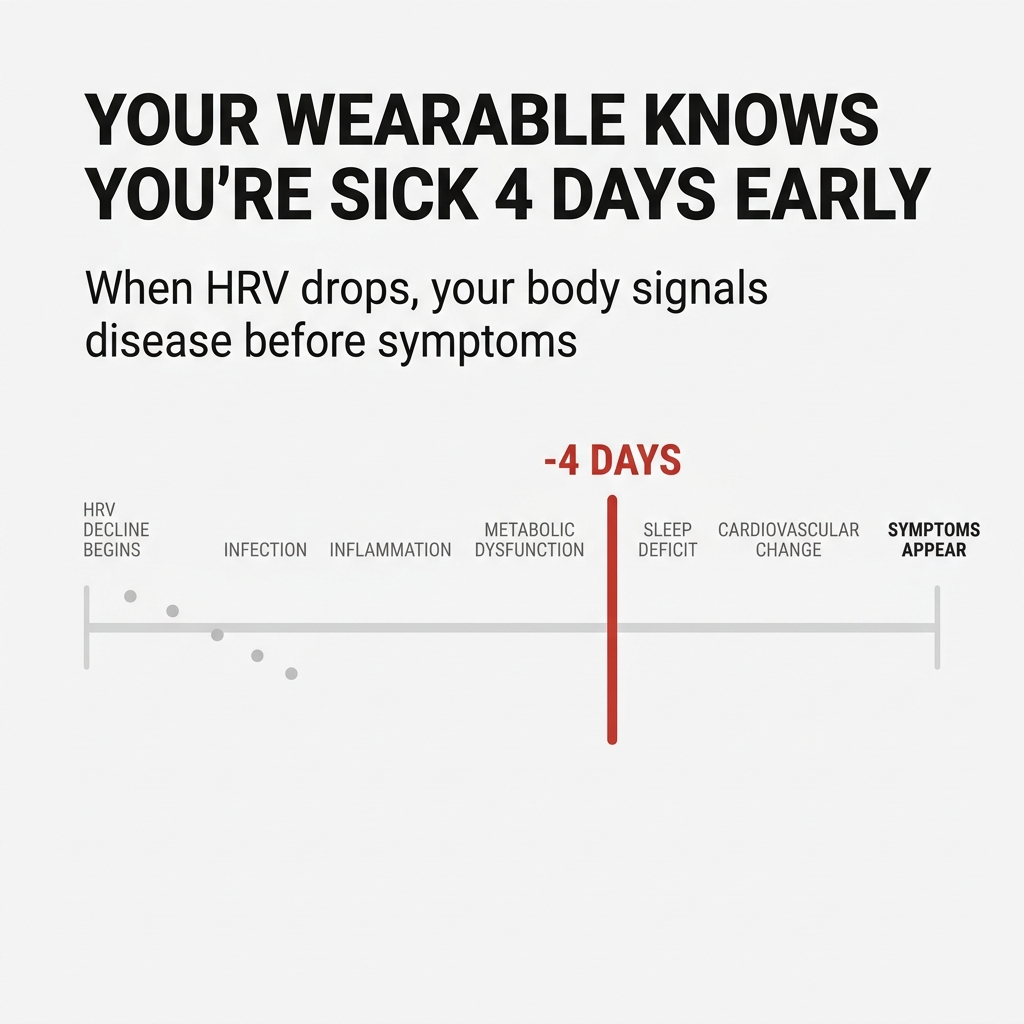
HRV changes can detect infections 3-4 days before you feel sick.
Clinical research on sepsis showed observable changes in heart rate characteristics as early as 3 to 4 days before onset, with most studies showing HRV analysis can diagnose sepsis 12 to 24 hours before traditional clinical methods catch it.
More recent work on COVID-19 demonstrated autonomic dysfunction appearing seven days before positive tests in healthcare workers. Wearable technology successfully predicted infection through HRV changes one day before positive tests in NCAA Division 1 female athletes.
When I see that early infection signal in someone's data, I look for confirmation in other metrics. From a wearable perspective, infection shows up as changes in temperature, breathing patterns, and heart rate alongside the HRV drop.
You're triangulating multiple data streams to understand what's actually happening.
Numerous chronic health conditions suppress HRV. Cardiac, metabolic, pulmonary, neurologic, psychiatric conditions all show this pattern.
The research on chronic inflammation is clear: autonomic dysfunction is associated with functional and structural changes in target organs including the heart, brain, kidneys, and blood vessels. This increases cardiovascular risk measurably.
Inflammation markers like C-reactive protein and fibrinogen correlate positively with reduced HRV. The autonomic nervous system plays a role in both physiological situations and various pathological processes.
When inflammation becomes chronic, it doesn't just suppress HRV temporarily. It creates sustained sympathetic dominance that shows up as a persistent downward trend in your data.
The metabolic connection surprises people most.
There's a documented association between metabolic syndrome, prediabetes, type 2 diabetes, chronic kidney disease, dyslipidemia, and low HRV.
The mechanism is specific. Research shows glucose metabolism markers including glucose, insulin, and HOMA index were inversely associated with HRV scores. Insulin resistance is linked to reduced HRV independent of other factors.
Women with metabolic syndrome showed significantly lower HRV parameters compared to those without. Waist circumference was most commonly associated with HRV changes, especially in frequency domain parameters.
Recent 2025 research confirmed that reduced HRV is associated with insulin resistance, inflammation, and increased cardiovascular risk in individuals with obesity.
Most people with prediabetes or insulin resistance don't realize this is happening. They feel fine. Their wearable is telling them something their body hasn't communicated through symptoms yet.
This is exactly what I mean when I talk about reverse-engineering disease before it forms.
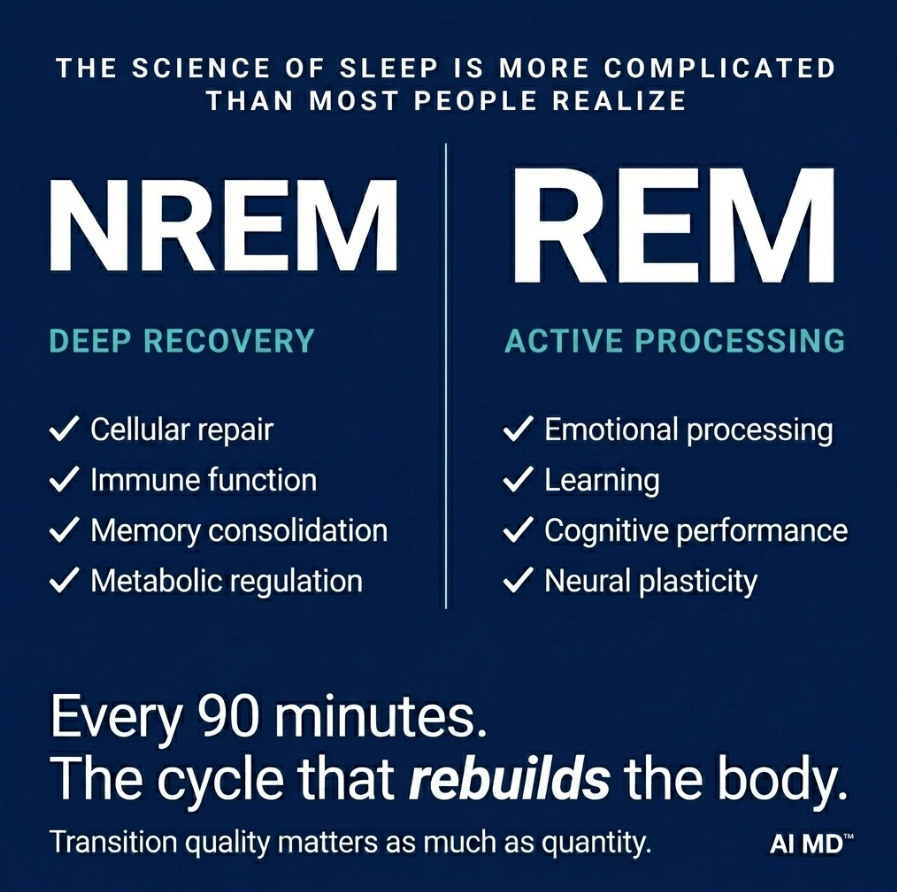
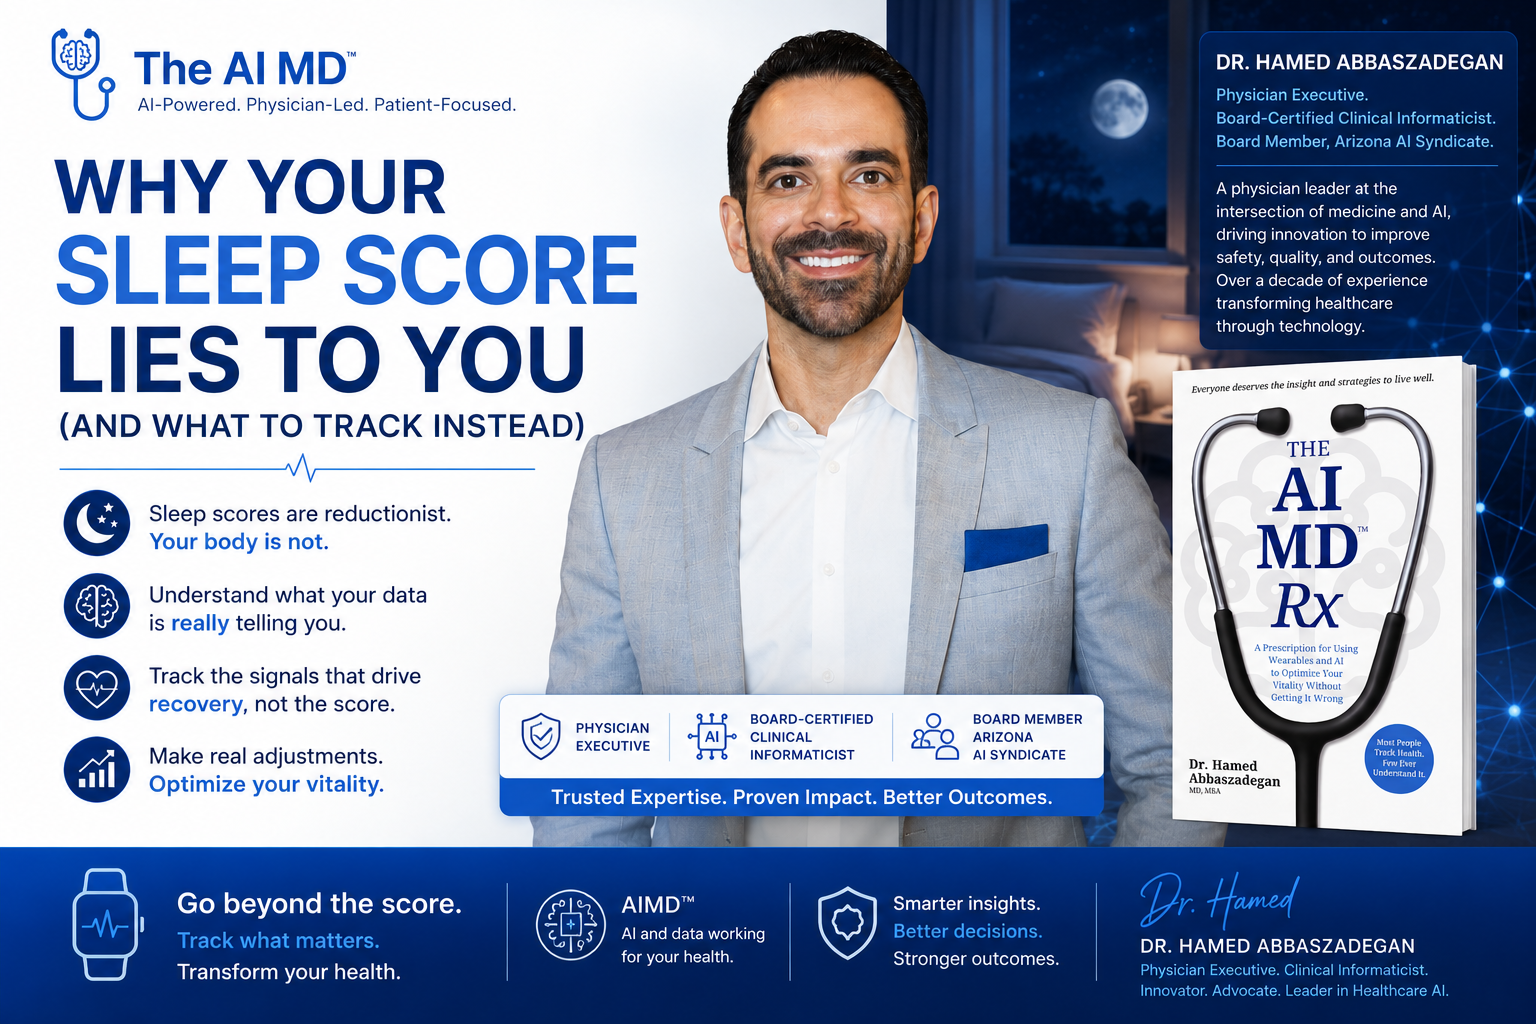
People assume good sleep automatically restores HRV.
It's more complicated than that.
The relationship between sleep quality and HRV restoration is bidirectional and measurable. During healthy sleep, heart rate typically drops 20-30% below daytime resting rates, reflecting the body's shift into restoration mode.
Research on sleep restriction showed HRV rebounds in the first hour of sleep, with high-frequency components correlated with delta power during recovery sleep. This suggests a role for autonomic homeostasis.
But here's what matters: one night of recovery sleep is insufficient to restore autonomic homeostasis after persistent sleep restriction. Changes are maintained for multiple nights.
And HRV is exquisitely sensitive to stimulants, emotional stress, ambient temperature, meal timing, and many more factors. Any one of these can overwhelm the recovery boost from good sleep.
This is why you can sleep eight hours and still wake up to declining HRV. The data is telling you something else is driving sympathetic dominance.
Chronic sympathetic nervous system overactivity represents a key pathophysiological mechanism in cardiovascular disease progression.
When sustained chronically, sympathoexcitatory effects initiate a cycle of heart failure progression. They become associated with cardiomyocyte apoptosis, maladaptive ventricular and vascular remodeling, arrhythmogenesis, and poor prognosis.
This validates why persistent low HRV trends signal more than temporary stress. They can indicate sustained autonomic dysfunction requiring intervention.
Analysis of over 4,000 individuals found that certain HRV patterns during sleep predicted future health conditions including stroke, depression, and cognitive dysfunction years before symptoms appeared.
Your wearable isn't just tracking a wellness metric. It's measuring autonomic balance that predicts disease progression.
The absolute number on your wearable doesn't tell you much.
What tells you something: a downward trend from your personal baseline.
When you see that trend, you're looking at sympathetic overactivation. The question becomes: what's driving it?
The research shows multiple causative factors:
Impending infection detectable 3-4 days before symptoms
Chronic inflammation from various disease states
Metabolic dysfunction including insulin resistance and prediabetes
Inadequate sleep recovery that compounds over multiple nights
Cardiovascular changes that predict future disease
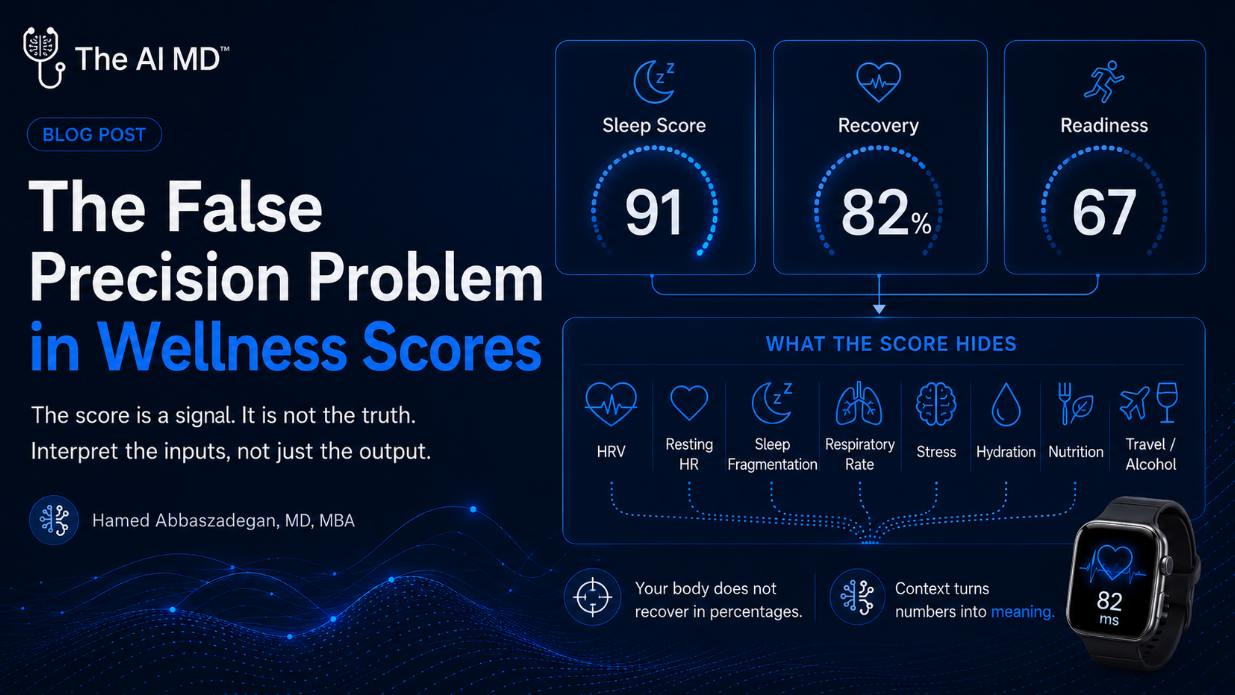
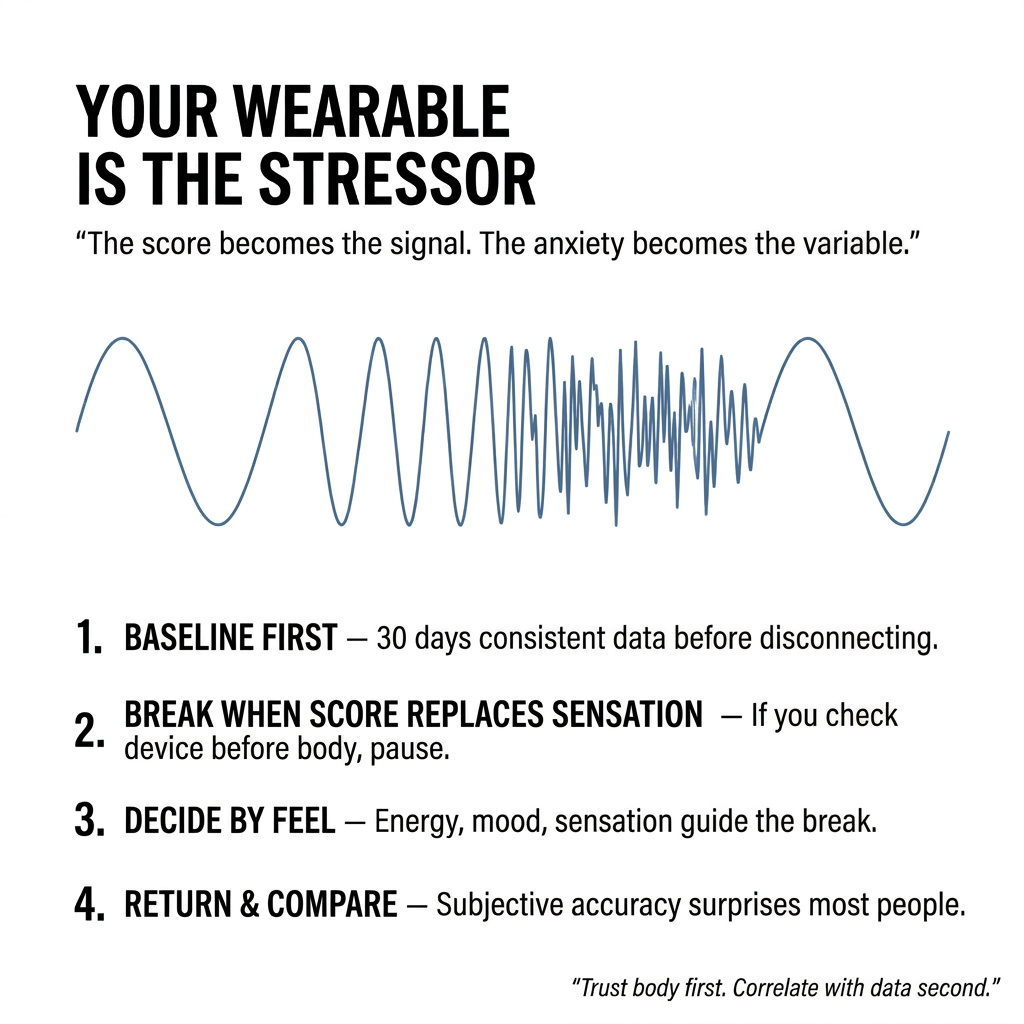
You triangulate by looking at other metrics. Temperature changes. Breathing patterns. Resting heart rate. Sleep architecture. Meal timing. Training load.
Data without interpretation is noise. Interpretation without action is academic.
The goal is to identify which factor is suppressing your HRV, then intervene before it progresses to disease. That's what I mean by prevention through prediction.
Your wearable gives you the early warning system. The research gives you the framework for understanding what the warnings mean. What you do with that information determines whether you're tracking metrics or actually optimizing health.
Most people are just tracking.
The opportunity is in the interpretation.


%20(1880%20x%20940%20px)%20(3%20x%204%20in)%20(1).png)


.png)


Stay Connected
If you’d like these insights delivered straight to your inbox, you can sign up below. You’ll receive evidence-based perspectives on AI in healthcare, practical implementation guidance, and updates on speaking engagements and media appearances.